
RNA-seq data analysis: bulk, single-cell and spatial
From differential expression to cell trajectories and tissue maps, Sycomia analyzes your transcriptomics data to answer your biological question, with a scientific report and interpreted results.
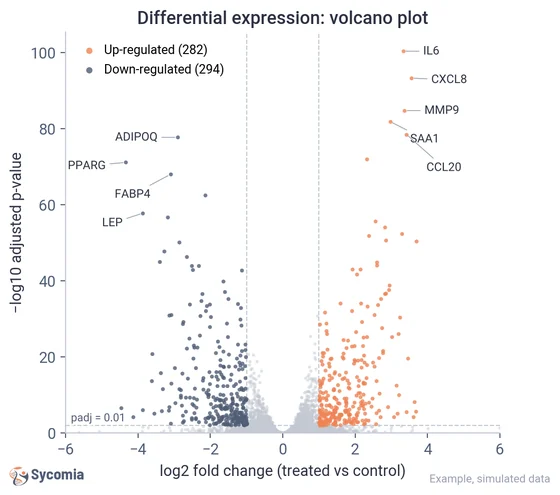
Bulk RNA-seq
Bulk RNA-seq sequences the RNA extracted from a sample (tissue, cell culture, biopsy, blood…). It measures the average expression level of each gene, for tens of thousands of genes at once. It is the reference approach to compare conditions: treated versus control, diseased versus healthy, several time points or genotypes.
Example analyses
- Quantification and differential expressionFrom raw reads to normalized expression levels, with quality control at every step, then statistical models adjusted for confounding factors, with false discovery rate (FDR) control.
- Functional enrichmentGene Ontology (GO), pathway analysis (KEGG, Reactome) and Gene Set Enrichment Analysis (GSEA), to guide the biological interpretation of expression changes.
- Isoforms, splicing and fusionsTranscript reconstruction and new isoforms, alternative splicing between conditions, and gene fusion detection that separates true fusions from artifacts.
- DeconvolutionEstimation of the proportions of cell types within complex tissue samples, to reveal cellular composition from bulk data.
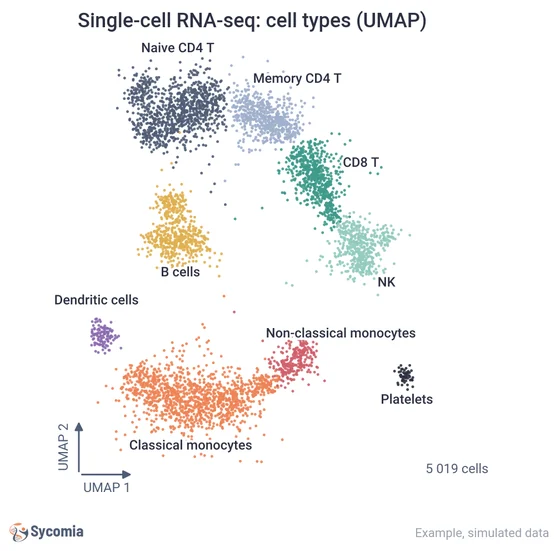
Single-cell RNA-seq
Single-cell RNA-seq measures gene expression cell by cell, across thousands to hundreds of thousands of cells. Where bulk gives an average, single-cell reveals the diversity of a sample: cell types and states, rare populations, transitions from one state to another.
Example analyses
- Quality control, integration and annotationCell filtering, doublet detection, ambient RNA and batch-effect correction, then clustering and annotation of cell types, including rare populations.
- Trajectories and pseudotimeReconstruction of differentiation paths by ordering cells along a pseudotime, with RNA velocity to estimate the direction of transitions.
- Comparison between conditionsPseudo-bulk differential expression within each cell type, and changes in cell type proportions between your groups.
- Multi-omics single-cellIntegration of CITE-seq data, which combine RNA and surface proteins in the same cells, for a richer view of cell identity.
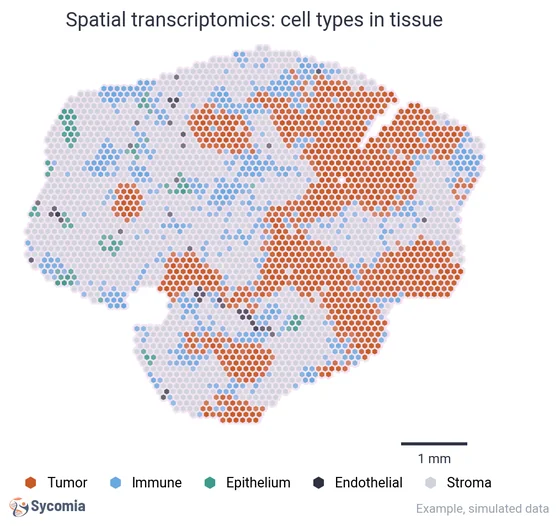
Spatial transcriptomics
Spatial transcriptomics measures gene expression directly on a tissue section, keeping the position of each measurement. You know which genes are expressed, and also where: in the core of a tumor, at its border, in the stroma or around vessels. It complements single-cell by placing cells back in their environment.
Example analyses
- Cell type mappingEstimation of cell type proportions in each spot by deconvolution against a single-cell reference, to map their distribution across the tissue.
- Spatial domains and spatially variable genesIdentification of spatial domains from the expression and position of spots or cells, and detection of genes whose expression follows a spatial pattern.
- Cell segmentationImage analysis to delineate cells and assign transcripts to them, to obtain per-cell expression profiles on high-resolution technologies.
- Cell-cell communicationInference of ligand-receptor interactions between neighboring cells, taking their proximity in the tissue into account.
Your analysis is not on the list? We also build custom analyses, tailored to your biological question. Let’s talk
Frequently asked questions
Another question about your RNA-seq project? Write to us, an expert will answer.
Contact usDo you analyze short-read and long-read RNA-seq data?
Yes. We work with short reads and long reads, which are particularly useful to reconstruct full-length transcripts and identify new isoforms.
Can you help us design an RNA-seq experiment?
Yes. Before sequencing, we can advise you on study design and on the choice between bulk, single-cell and spatial approaches, so that your data can answer your biological question.
Can single-cell data be combined with other omics?
Yes. We integrate multi-omics data measured in the same cells, such as CITE-seq (RNA and surface proteins). Your single-cell data can also serve as a reference for other data in the project: deconvolution of bulk or spatial data, or integration with epigenomic data.
What does an RNA-seq analysis report contain?
Quality control, the results of each analysis with publication-ready figures, result tables and, above all, the biological interpretation of the results.
Is my data kept confidential?
Yes. We sign an NDA on request, before any exchange of data. Your data is processed on our own servers, clinical data is hosted in France by a certified health data host (HDS), and your data is deleted within 30 days of the end of the project, or earlier on request, in line with the GDPR.
Related services
Let’s talk about your RNA-seq project
Bulk, single-cell or spatial: tell us about your biological question and your data, and we will propose the right analysis strategy.