
Proteomics data analysis: affinity and mass spectrometry
Affinity proteomics or untargeted mass spectrometry: Sycomia analyzes your proteomics data to identify biomarkers, understand protein functions and connect them to your other omics data. We work in particular with Olink®, SomaScan® and immunoassay data.
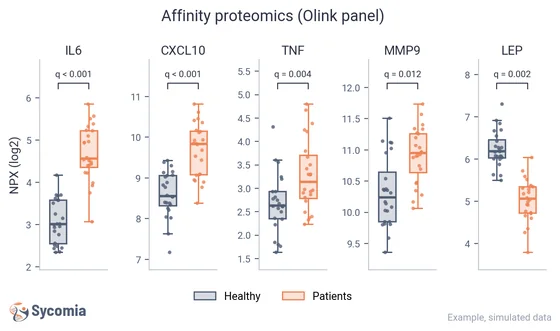
Affinity proteomics
Affinity proteomics measures a predefined panel of proteins, often in blood, using antibodies or aptamers, with high sensitivity. Olink and SomaScan platforms measure the relative levels of hundreds to thousands of proteins to discover or validate biomarkers.
Example analyses
- Olink PEAOlink data across panels such as Target 96, Explore HT and Reveal: quality control, bridging across plates or batches, handling of values below the limit of detection, then differential analysis.
- SomaScanUp to 11,000 proteins: normalization, quality control, aptamer annotation and differential analysis.
- Multiplexed immunoassaysLuminex and MSD data: standard curve fitting (4PL, 5PL), handling of quantification limits and plate effects, comparison between groups.
- Biomarker signaturesProtein selection, predictive models, ROC curves and cross-validation.
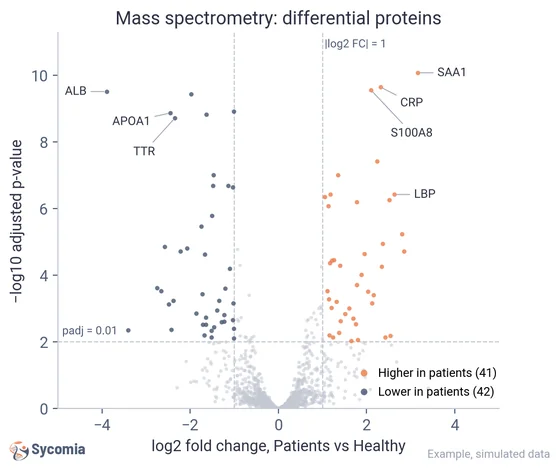
Untargeted mass spectrometry
Untargeted mass spectrometry identifies and quantifies the proteins in a sample, without a predefined list. It gives a broad view of the proteome to find the proteins that change between your conditions.
Example analyses
- Protein and peptide identificationProtein database searches (UniProt) on DDA or DIA data, with a false discovery rate controlled at 1% at peptide and protein level.
- QuantificationLabel-free (LFQ, DIA) or isobaric labeling (TMT) quantification, with normalization across samples and batches.
- Missing valuesThe challenge specific to mass spectrometry: filtering and imputation adapted to whether values are missing at random or because of low abundance.
- Differential abundanceSignificant abundance changes between conditions, with false discovery rate (FDR) control, for biomarker discovery and to guide biological interpretation.
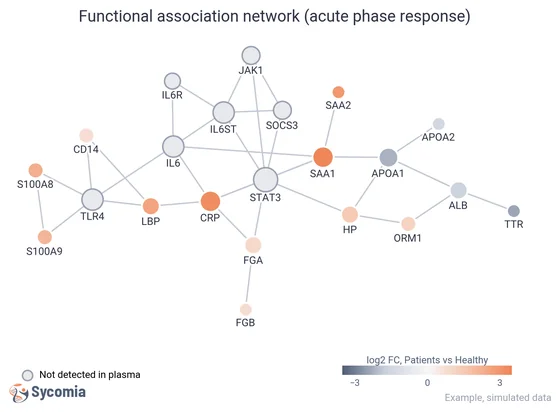
Functional protein analysis
Functional analysis puts proteins back in context: which other proteins they are associated with, which domains they carry, in which biological pathways they act.
Example analyses
- Association networksInteraction and functional association networks from reference databases such as STRING, to put your proteins in context and identify modules and central proteins.
- Differential modulesAbundance changes mapped onto the network, to spot groups of associated proteins that change together between your conditions.
- Domains and motifsAnnotation of protein domains and motifs, to shed light on function, structure and interaction capabilities.
- Functional enrichmentGO and KEGG enrichment analyses, using the detected proteome as the background, to highlight the pathways and biological processes represented in your data.
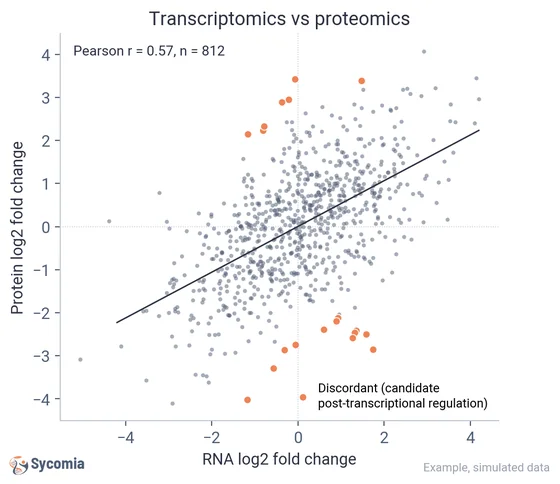
Multi-omics integration
RNA and proteins do not always change together. Combining proteomics and transcriptomics highlights discordances suggestive of post-transcriptional regulation, and strengthens biomarker discovery.
Example analyses
- Proteomics and transcriptomicsCorrelation of protein changes with RNA changes, to spot discordances suggestive of post-transcriptional regulation.
- Joint pathway analysisBiological pathways analyzed by combining RNA and protein signals, to guide biological interpretation.
- Multi-layer integrationLatent factors and combined signatures, to connect several omics measured on the same samples.
- Sample stratificationClassification and discovery of sample subgroups from multi-omics data, using clustering and machine learning.
Your analysis is not on the list? We also build custom analyses, tailored to your biological question. Let’s talk
Frequently asked questions
Another question about your project? Write to us, an expert will answer.
Contact usWhich proteomics technologies do you support?
Affinity platforms such as Olink (Target 96, Explore HT, Reveal) and SomaScan, multiplexed immunoassays, and untargeted mass spectrometry.
Can you combine our proteomics and transcriptomics data?
Yes. We correlate protein abundance with RNA expression and infer the pathways and networks involved, for a multi-layered view of your biology.
Can proteomics data be used to classify samples?
Yes. We apply machine learning to stratify samples, discover subgroups and build classification models from your proteomics data.
Is my data kept confidential?
Yes. We sign an NDA on request, before any exchange of data. Your data is processed on our own servers, clinical data is hosted in France by a certified health data host (HDS), and your data is deleted within 30 days of the end of the project, or earlier on request, in line with the GDPR.
Related services
Let’s talk about your proteomics project
Targeted or mass spectrometry: tell us about your biological question and your data, and we will propose the right analysis strategy.